 PCB
PCB FPC
FPC Rigid-Flex
 FR-4
FR-4 HDI PCB
 Rogers High-Frequency Board
 PTFE Teflon High-Frequency Board
 Aluminum
 Copper Core
 PCB Assembly
 LED light PCBA
 Memory PCBA
 Power Supply PCBA
 New Energey PCBA
 Communication PCBA
 Industrial Control PCBA
 Medical Equipment PCBA
 Testing Service
 PCBA Testing Service
 Certification Application
 RoHS Certification Application
 REACH Certification Application
 CE Certification Application
 FCC Certification Application
 CQC Certification Application
 UL Certification Application
 Transformers, Inductors
 High Frequency Transformers
 Low Frequency Transformers
 High Power Transformers
 Conversion Transformers
 Sealed Transformers
 Ring Transformers
 Inductors
 Wires,Cables Customized
 Network Cables
 Power Cords
 Antenna Cables
 Coaxial Cables
 Net Position Indicator
 Solar AIS net position indicator
 Capacitors
 Connectors
 Diodes
 Embedded Processors & Controllers
 Digital Signal Processors (DSP/DSC)
 Microcontrollers (MCU/MPU/SOC)
 Programmable Logic Device(CPLD/FPGA)
 Communication Modules/IoT
 Resistors
 Through Hole Resistors
 Resistor Networks, Arrays
 Potentiometers,Variable Resistors
 Aluminum Case,Porcelain Tube Resistance
 Current Sense Resistors,Shunt Resistors
 Switches
 Transistors
 Power Modules
 Isolated Power Modules
 AC-DC Power Modules
 DC-AC Module(Inverter)
 RF and Wireless
A Detailed Guide to Basic Concepts and Daily Outputs of PCBA Production Lines
2025-11-23
I. BasIC Concepts and Daily Outputs of Production Lines
1. Definition of a Production Line
- A production line refers to the entire manufacturing process from raw material input to finished product output, including stages such as SMT (SuRFace Mount Technology), DIP (Dual In-line Package assembly), and testing.
- Line Structure:
- SMT Line: Primarily responsible for automatically mounting components onto PCBs using pick-and-place machines.
- DIP Line: Handles through-hole components that require manual or semi-automatic insertion, followed by wave or reflow soldering.
- Test Line: Conducts functional tests, in-circuit tests (ICT), and burn-in tests on assembLed Pcbs.
2. Equipment Composition of Production Lines
- SMT Equipment: Pick-and-place machines, reflow ovens, AOI (Automated Optical Inspection) systems.
- DIP Equipment: Manual insertion stations, wave soldering machines, rework stations.
- Testing Equipment: ICT (In-Circuit Testers), FCT (Functional Circuit Testers), aging test racks.
3. Overview of Production Capacity
- Capacity Definition: The number of units a line can produce within a given time, typically expressed in “pcs/hour” or “pcs/day.”
- Key Influencing Factors:
- Equipment efficiency (OEE – Overall Equipment Effectiveness)
- Operator skill level
- Process complexity
- Downtime (e.g., material changeovers, machine setup)
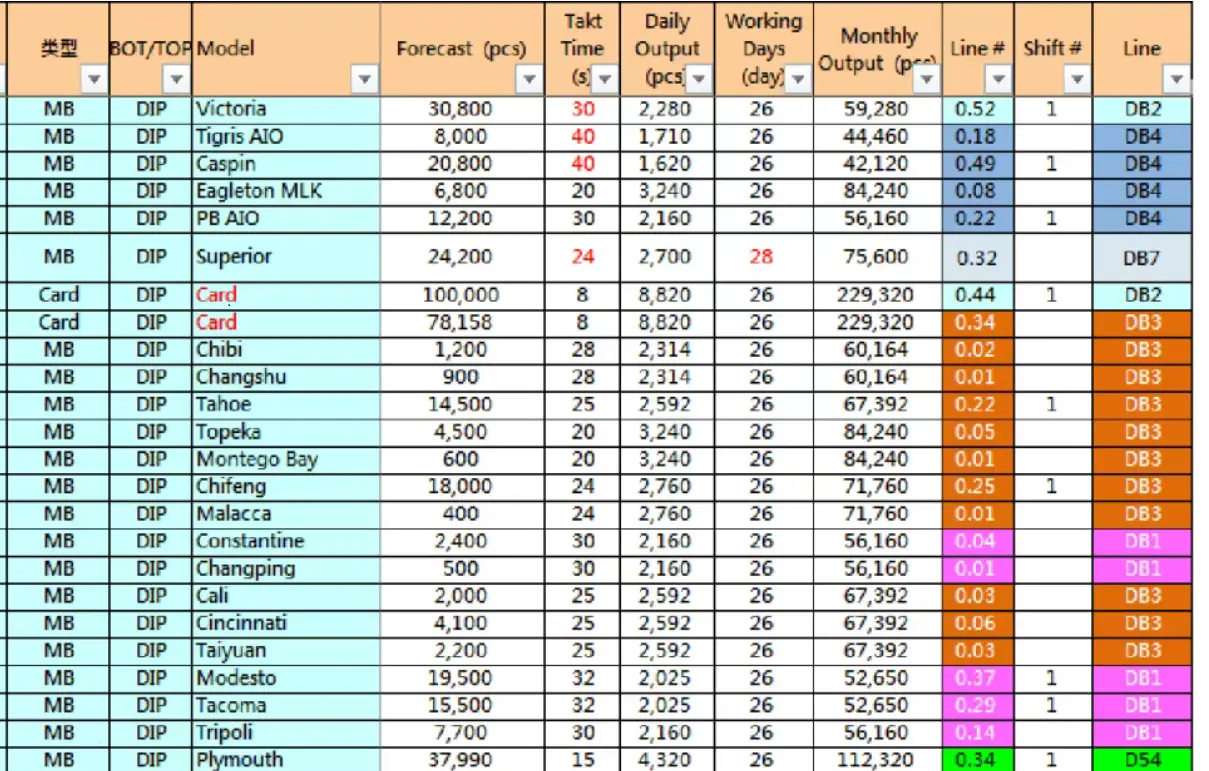
4. Production Capacity Calculation
- Formula:

- Example: If a pick-and-place machine processes 1,000 components per hour and operates for 8 hours, its daily capacity is 8,000 components.
II. Workforce Planning for Production Lines
1. Workforce Requirement Calculation Models
- Standard Time Method: Estimates required labor based on historical cycle time data.
- Man-to-Machine Ratio: Determines staffing levels based on equipment count and operational ratios.
- Rule of Thumb: Typically, 1–2 operators per SMT machine; 3–5 inserters per DIP line.
2. Dynamic Workforce Adjustment Mechanism
- Real-Time Monitoring: Use MES (Manufacturing Execution System) to track workstation progress.
- Flexible Allocation: Reassign personnel from non-bottleneck areas to support overloaded stations.
- Cross-Training: Maintain a pool of multi-skilled workers for rapid response to disruptions.
III. Methods for Establishing Standard Manpower
1. On-Line On-Site Labor Cost Assessment
- Steps:
- Record actual staffing on the production floor.
- Analyze workload and efficiency per role.
- Calculate theoretical headcount using standard time tables.
- Compare actual vs. theoretical values to optimize resource allocation.
2. Off-Line Standardized Manpower Setting
- Objective: Create uniform staffing standards for cross-line benchmarking and management.
- Approach:
- Simulate manpower needs using BOM (Bill of Materials) and routing data from ERP/MES systems.
- Benchmark against industry averages.
- Review and update standards periodically.
IV. Production Line Evaluation (Primarily Efficiency Rating)
1. Production Target Achievement Rate
- Definition: (Actual Output ÷ Planned Output) × 100%
- Significance: Reflects overall line performance.
2. Per-Employee Output Contribution
- Calculation: Total Output ÷ Total Labor Hours
- Use: Supports performance evaluation and incentive programs.
3. Line Utilization Rate (Load Rate)
- Definition: (Actual Operating Time ÷ Available Time) × 100%
- Target: >90%
4. Line Balance Rate
- Definition: Measures how evenly workloads are distributed across processes to avoid bottlenecks.
- Optimization Strategies:
- Re-sequence operations
- Add buffer zones
- Introduce automation at critical stations
V. KPI Framework for Production Line Outputs
1. Key Performance Indicators (KPIs)
| KPI | Formula | Target |
|---|---|---|
| OEE (Overall Equipment Effectiveness) | (Availability × Performance × Quality) | >85% |
| First Pass Yield (FPY) | Units Passing Test on First Attempt ÷ Total Output | >95% |
| Cycle Time | Time from start to finish per unit | Minimize |
| Downtime Rate | Downtime ÷ Total Runtime | <5% |
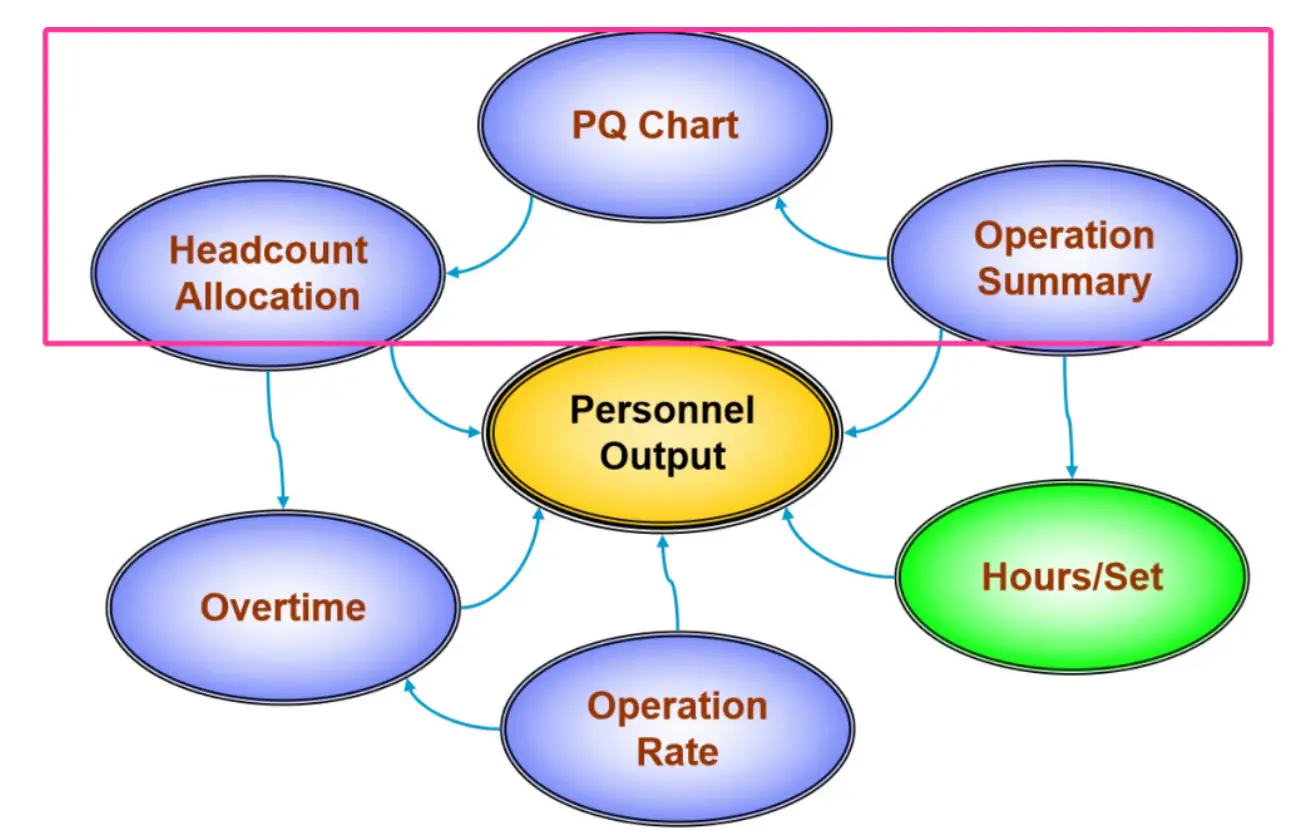
2. PD Chart (Confirm Ownership & Standard Manpower)
- The PD Chart (Process Duration Chart) is a tool for analyzing line balance and efficiency.
- Purpose: Identify bottleneck operations and optimize resource deployment.
- How to Create:
- List all operations with their standard times.
- Arrange them in sequence.
- Plot cumulative time to reveal the critical path (longest duration).
VI. HC Allocation (Daily Tracking of DL & DOL Standard Manpower)
1. Headcount Allocation
- Purpose: Allocate daily labor resources to ensure smooth execution of production plans.
- Input Data:
- Daily order volume
- Standard time per product model
- Equipment availability
- Output:
- Required headcount per line
- Role-specific staffing numbers
2. Theoretical Standard Headcount (TSH) vs. Actual Staffing Headcount (ASH)
- TSH: Minimum theoretically required workforce.
- ASH: Actual deployed workforce.
- Gap Analysis: Used to evaluate labor efficiency and identify overstaffing or shortages.
3. Monthly Headcount Budget
- Basis: Annual production plan and seasonal demand forecasts.
- Review Cycle: Updated monthly, with weekly adjustments if needed.
4. Temporary Staffing
- Scenarios: Rush orders, equipment breakdowns, absenteeism.
- Sources: Internal transfers, external contractors, temporary workers.
- Requirements: Must undergo safety and job training before assignment.
Conclusion and Recommendations
This document systematically outlines the core elements of PCBA production line management, covering five key modules: conceptual understanding, workforce planning, efficiency evaluation, KPI monitoring, and labor allocation. For factory managers, mastering these concepts enables the following outcomes:
- Improved Productivity: Scientific capacity planning and staffing maximize equipment utilization.
- Reduced Operational Costs: Minimizes labor waste and prevents over- or under-staffing.
- Enhanced Product Quality: Stable production rhythms support consistent process control and higher yields.
- Data-Driven Decision Making: Provides factual basis for strategic decisions like capacity expansion or capital investment.